5 CASE STATISTICS
5.1 Introduction
The case statistics provide some indicators of the overall quality of the cases, - either deals or investors -, and on the other hand give an overview, how many cases are publicly available (active) and how many are in any other non-public state.
The case statistics are listed in the menu, when clicking on the user login. They are only available for logged-in users.
5.2 The case statistics interface
5.2.1. Introduction
By default the case statistics include all deals. But at the top there are two drop-downs which give the user the possibility to filter the statistics.
 |
- Region: When a region is selected, the total number of deals equals to all deals from the selected region.
- Country: When a country is selected, the total number of deals equals to the total all deals of the selected target country.
The case statistics interface is divided into three sections:
- Quality goals: A few indicators concerning the quality of the data
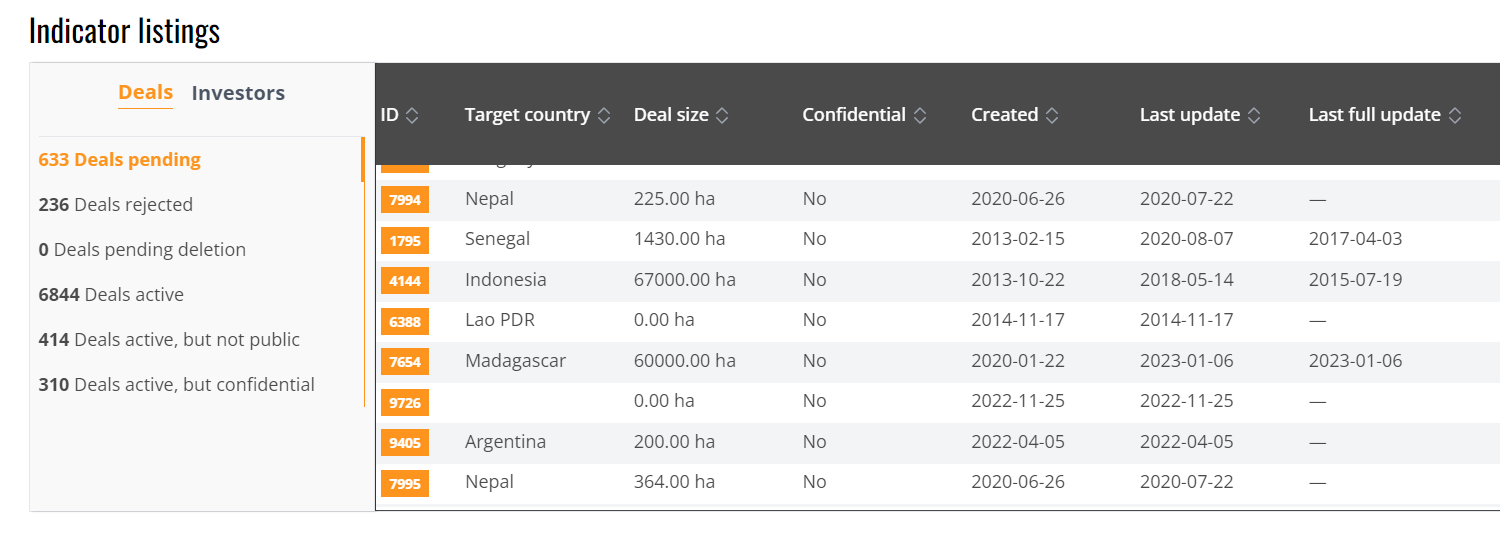
- Indicator listings: Different totals representing the current number of different selections.
- Changes within timespan: Indicators showing the number of certain changes that happened within a specified timespan
5.2.2. Quality goals
Some indicators for quality goals are listed here. It includes all active deals either global or based on the region or target country selected at the top. The figures are valid for the exact moment at which the user calls up the case statistics.
 |
|
Indicator |
Definition |
|
Publicly visible deals |
All active deals which are publicly visible and not set confidential. This is the number of deals visible for not logged-in visitors. |
|
Deals with multiple data sources |
Number of active deals, which contain more than one data source. |
|
Deals georeferenced with high accuracy |
Number of active deals with at least one location with either accuracy level ‘Coordinates’ or ‘Excact location’ or at least one polygon. |
|
Deals with polygon data |
Number of active deals with at least one polygon added for either a production area, contract area or intended area. |
|
Publicly visible investors |
All active investors, which are publicly visible and not set confidential. |
|
Investors with name |
Number of all active investors with a name. This excludes all ‘Unknown investors’. |
5.2.3. Indicator listings
This table lists figures for deals and investors that are in various workflow steps. This gives an overview on how many cases still need to be approved and set active and are not publicly visible.

Indicators for deals
|
Indicator |
Description |
|
Deals pending |
Number of all deals for which the newest version has not yet been activated. The newest version in one of the following stages: Draft, submitted for review, submitted for activation. |
|
Deals rejected |
Number of deals for which the newest version is ‘rejected’. This was a possible state before the switch to the new workflow management, but was removed with the new workflow. Deal versions with this state should either be moved to ‘Request improvement’ or deleted. |
|
Deals active |
Number of deals active. This includes all ‘not public’, yet active deals. |
|
Deals active, but not public |
Number of deals active, but not publicly visible. This includes deals, which don’t fulfil the minimum criteria, as well as deals set confidential. |
|
Deals active, but confidential |
Number of deals, which are active and fulfil the minimum criteria, but are set confidential manually by an administrator. |
Indicators for investors
|
Indicator |
Description |
|
Investor pending |
Number of all investors for which the newest version has not yet been activated. The newest version in one of the following stages: draft, submitted for review, submitted for activation. |
|
Investors rejected |
Number of investors for which the newest version is in state ‘rejected’. This was a possible state before the switch to the new workflow management, but was removed with the new workflow. Investor versions with this state should either be moved to ‘Request improvement’ or deleted. |
|
Investors active |
Number of investors active. This includes all ‘not public’, yet active investors. |
5.2.4. Changes within timespan
His table lists figures for certain activities that happened in a specific timespan. These activities include actions such as adding a new deal or investor or updates that happened for deals or investors.
Above the table there is a filter section in which the user can select the timespan for which he wants to get the figures.
|
|
Indicators for deals
|
Indicator |
Description |
|
Deals added |
Number of newly added (created) deals, regardless of their status, be it active, draft state, submitted to review or activation, within the given timespan. |
|
Deals updated |
Number of deals modified within the given timespan, regardless of their status. |
|
Deals fully updated |
Number of deals for which a version has been marked ‘fully updated’ within the given timespan. |
|
Deals activated |
Number of deals for which a version has been activated within the given timespan. |
Indicators for Investors
|
Indicator |
Description |
|
Investors added |
Number of newly added (created) investors, regardless of their status, be it active, draft state, submitted to review or activation, within the given timespan. |
|
Investors updated |
Number of investors modified within the given timespan, regardless of their status. |
|
Investors activated |
Number of investors for which a version has been activated within the given timespan. |

